Inside the Cockpit: How Gluon Turns AI Agents into a Managed Workflow
$ grep -n "^##" 2026-02-gluon-cockpit-ai-agents-managed-workflow.md
Part 2 of 4 in Gluon: Building an AI Agent Orchestrator series
The Question That Kept Interrupting
Four agents running. Auth bug. API refactor. Tests. A fourth — honestly, I'd scrolled through too many logs to remember what it was doing.
Every few seconds, the same question: is it still running?
Not "is the code good?" Not "did it pick the right approach?" Just: is it still running? The most basic question you can ask about a process, and I couldn't answer it without switching tabs and scanning walls of terminal output. That's the line between running agents and orchestrating them: the first is an experiment, the second is a workflow.
Why Cockpits Exist
In aviation, pilots handle the flying; the cockpit crew coordinates everything else — fuel, course, radio traffic, weather — multiple instruments feeding one unified picture. That's what was missing. Not smarter agents. A better cockpit:
Centralized information — one dashboard instead of scattered terminals: where are the agents, what are they doing, how much have they cost, what needs attention. Isolated actions — each agent works independently; git worktrees ensure one can't delete another's work. Real-time awareness — tool calls visualized as they execute, costs ticking up live. Multiple control surfaces — CLI, web dashboard, Telegram for phone checks, Discord for team coordination, PWA for mobile. Built-in safeguards — cost caps, iteration limits, circuit breakers that stop agents from looping forever.
From Intent to Execution in 30 Seconds
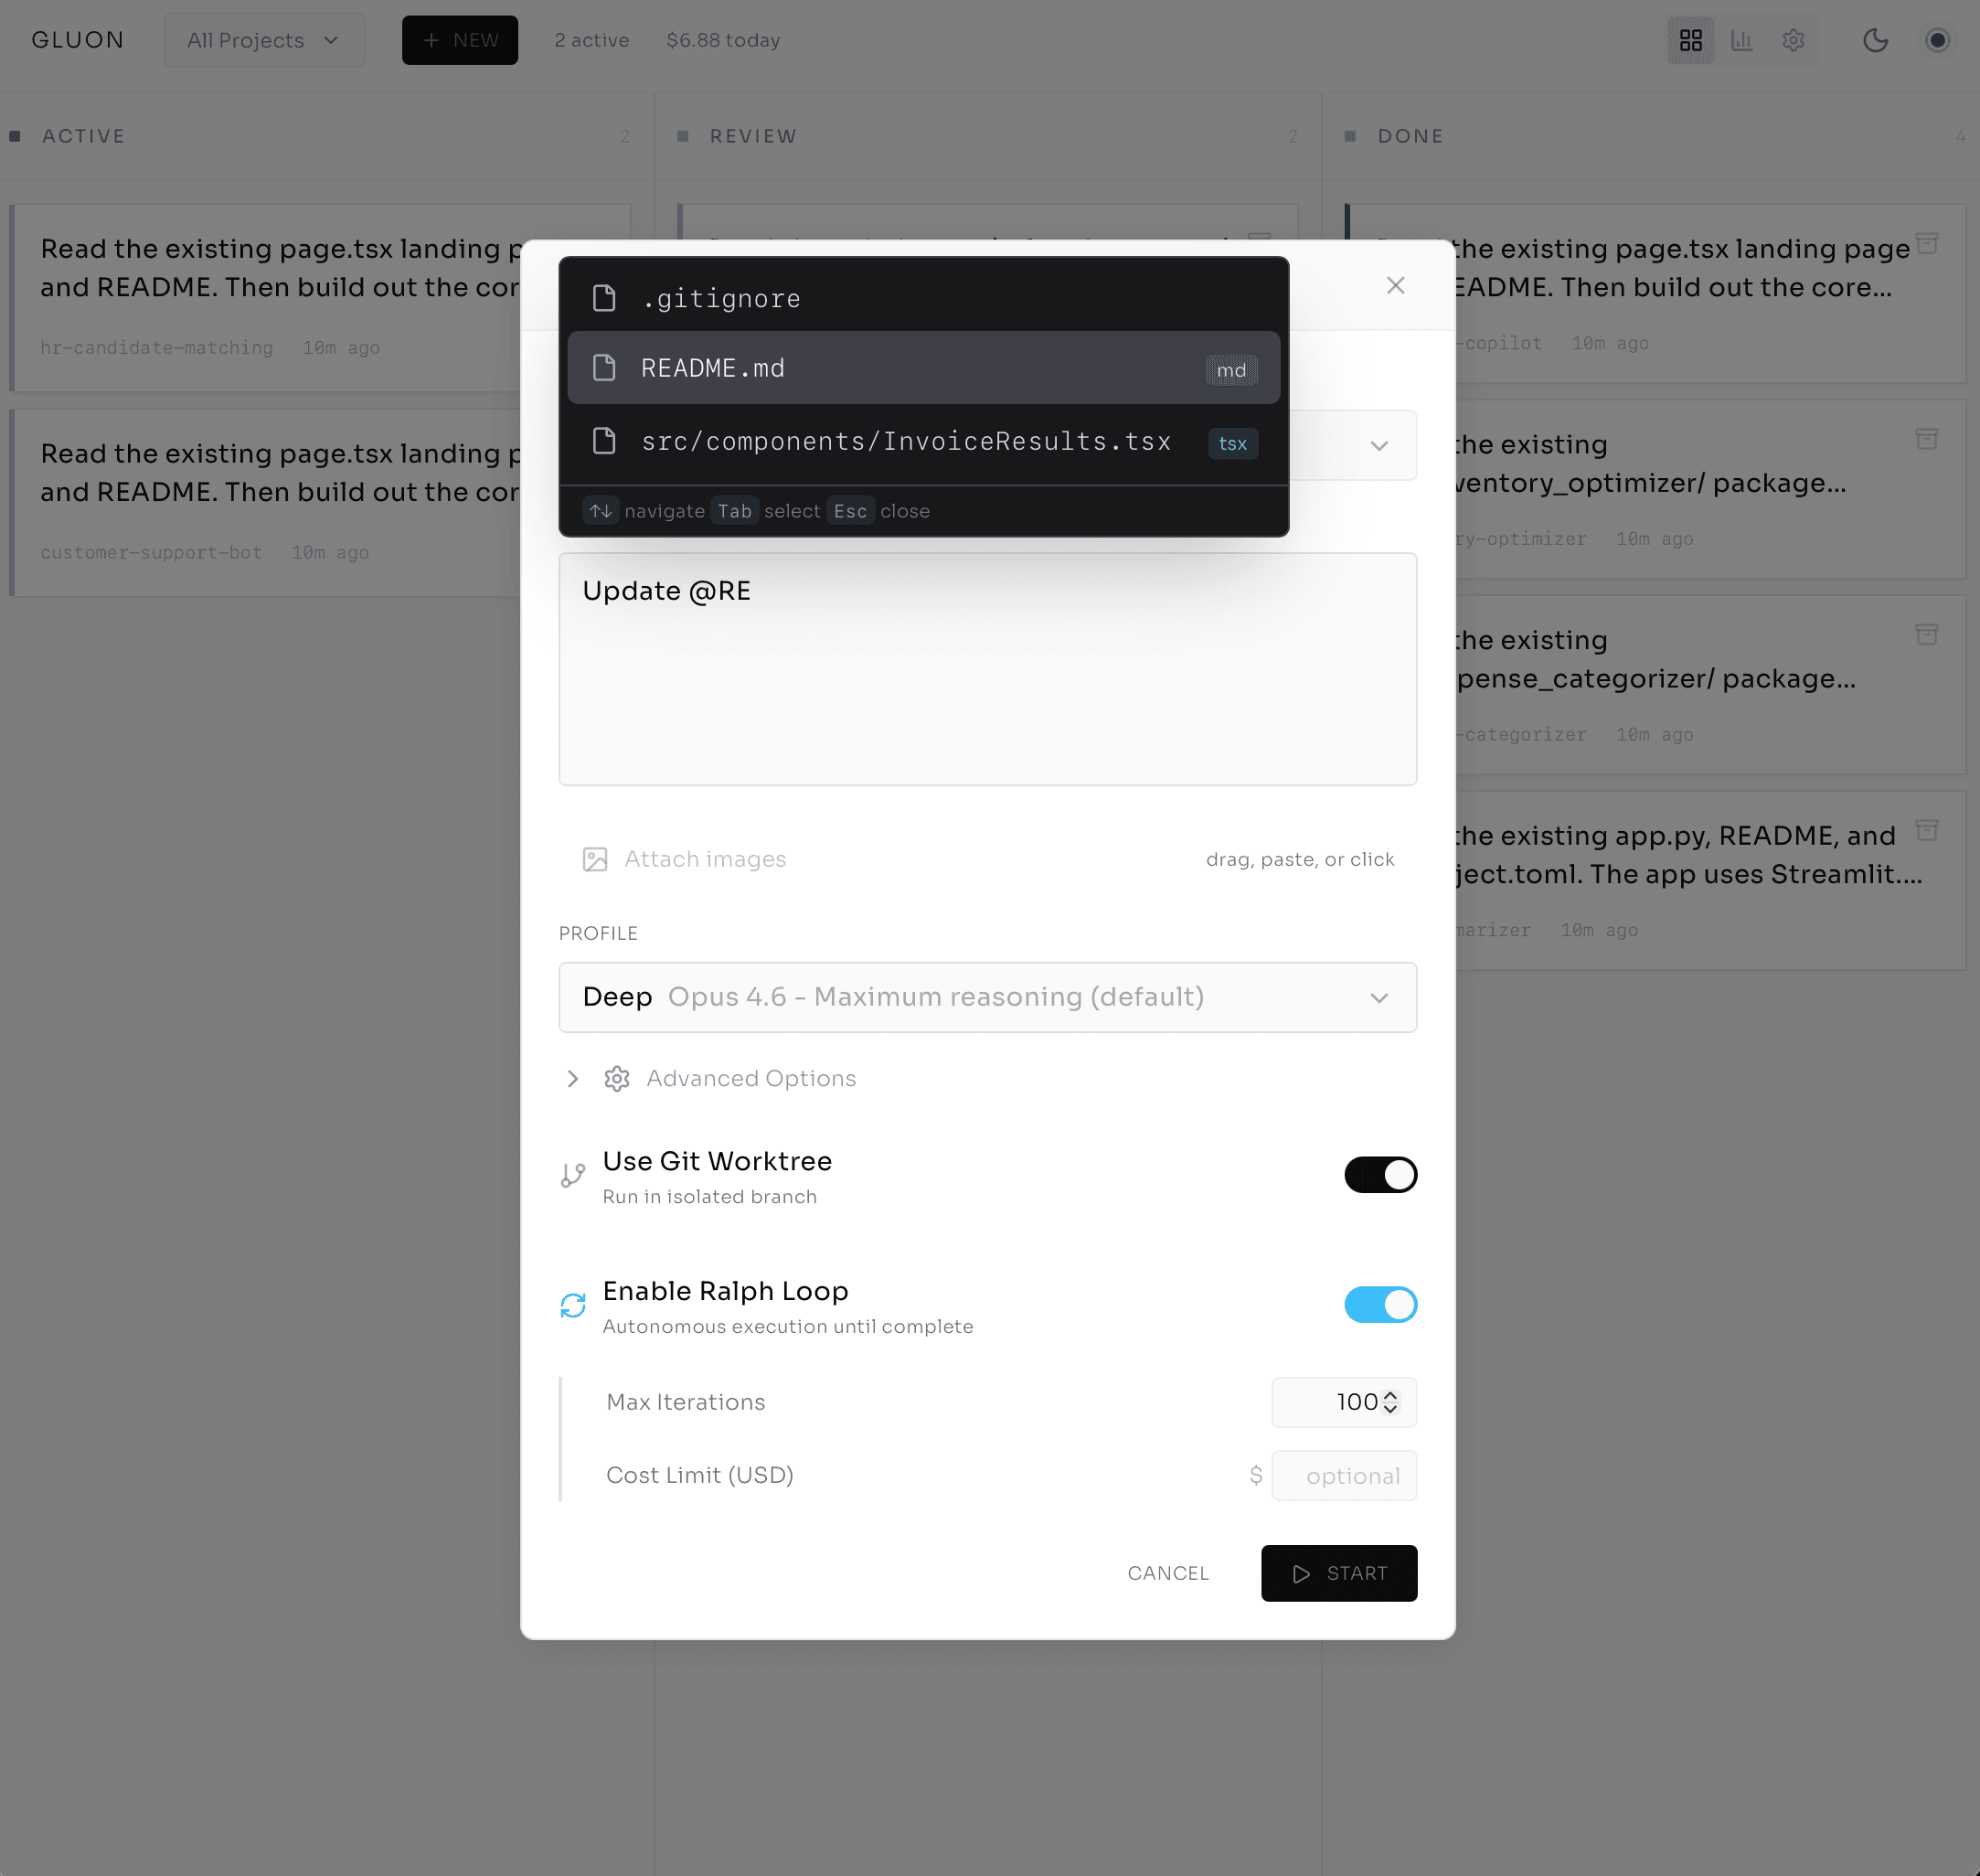
Here's what actually happens when I start work. I open the web dashboard and click the plus icon, and a task creation dialog appears.
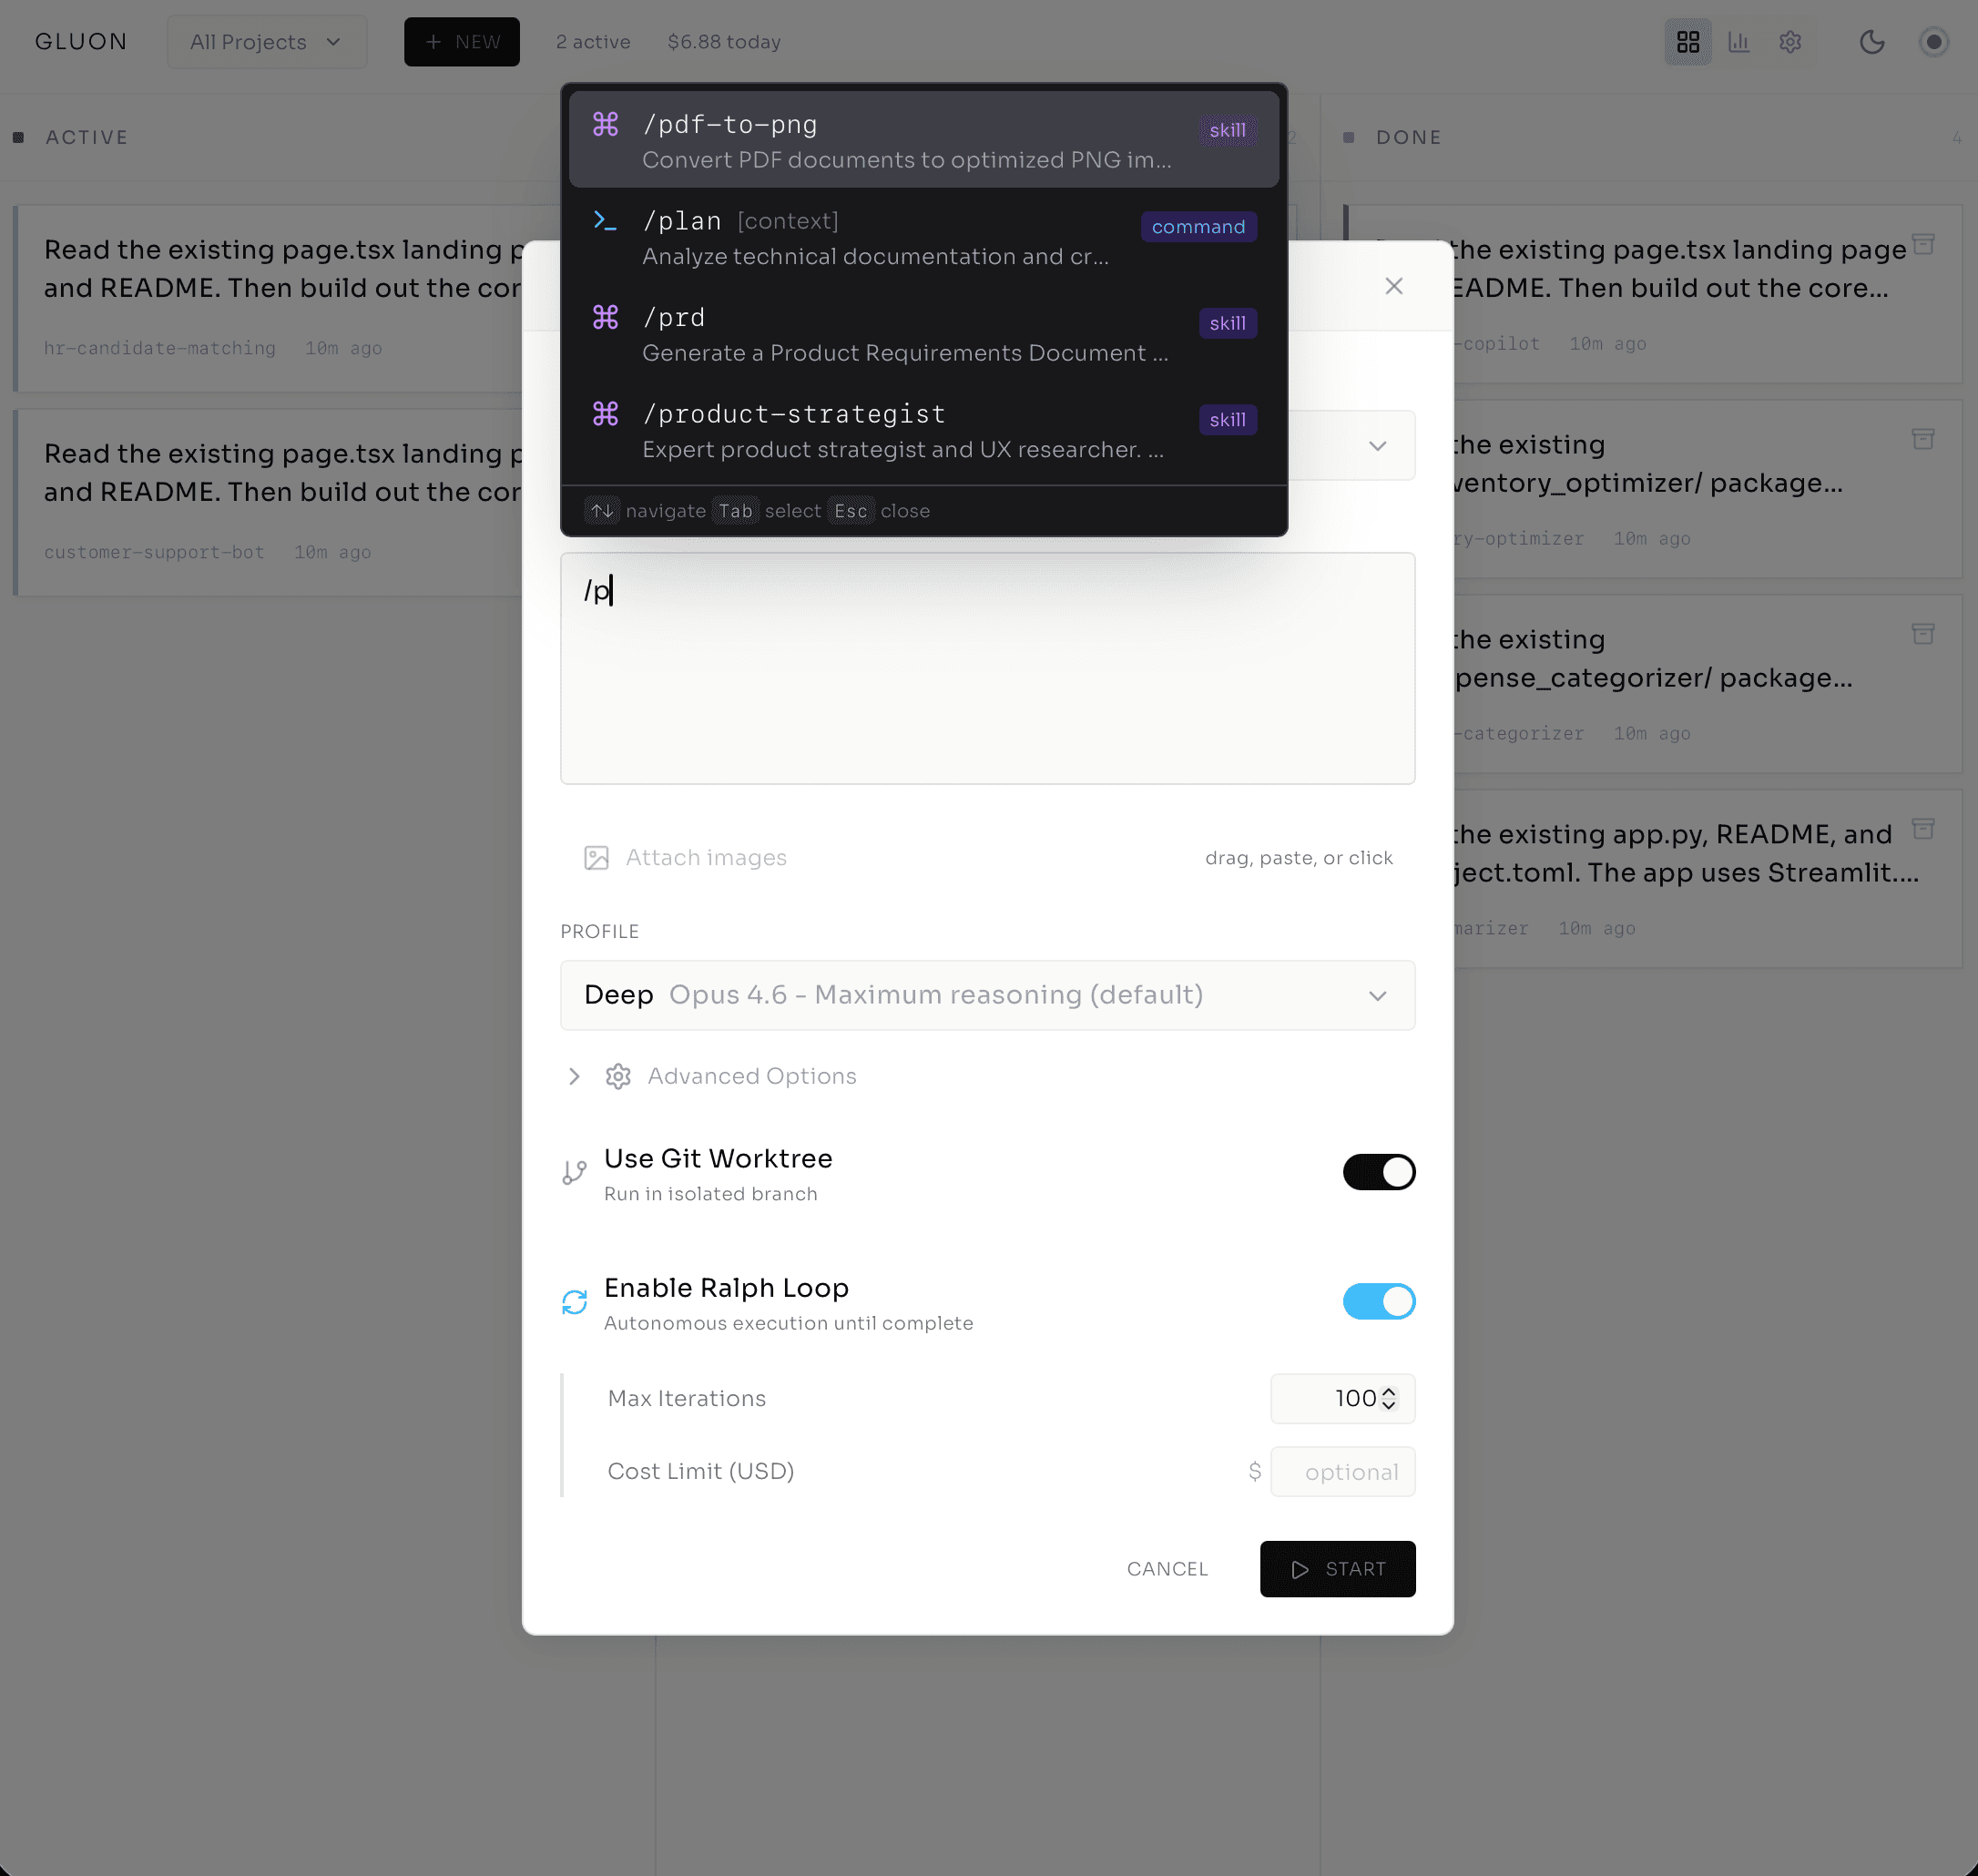
First: project selector. auth-service, grouped by workspace — this matters across team codebases. Then describe the work: I type /fix-auth-bug and Gluon autocompletes, then @src/auth/signup.ts to pull that file into the agent's context — no guessing about which file to look at.
Then profile selection — where model choice becomes a cost decision you make once, not a bill you discover later:
- Quick (Haiku) — fast, cheap, for simple fixes.
- Standard (Sonnet) — balanced. My default.
- Deep (Opus) — maximum reasoning for complex refactoring.
- Planning (Opus) — explicit plan-before-execute mode.
I pick Standard. Toggle on Git Worktree for isolation. Ralph Loop stays off — I want to watch this one before letting it run autonomous. I can attach an image too: screenshot of the bug, error logs, anything visual.
One click. Task created. Within 30 seconds, the agent is spinning — and I can watch it happen live.
Watching the Work — Not Waiting for It
The task opens in the Run Details modal. Tabs across the top: Output, Errors, Messages, Commits, Files, Attachments, Loop, History. I'm on Output.
The agent's thinking streams in real-time over a WebSocket — no polling, no refresh button. I'm seeing what it does as it happens. It reads the signup file. Identifies the bug — line 42, the email validation regex doesn't handle new TLDs like .cloud. Writes a test case that reproduces the error. Each step appears in the stream:
[TOOL CALL] file_read: src/auth/signup.ts (2.4KB)
[TOOL CALL] bash: npm test -- signup.test.ts (failed, as expected)
[TOOL CALL] file_write: src/auth/signup.ts (lines 40-45 modified)
[TOOL CALL] bash: npm test -- signup.test.ts (passed)
No terminal tab-switching. I'm watching a developer work — reading the file, writing a failing test, fixing the code, watching the test pass. Except this developer runs at machine speed and costs $0.47.
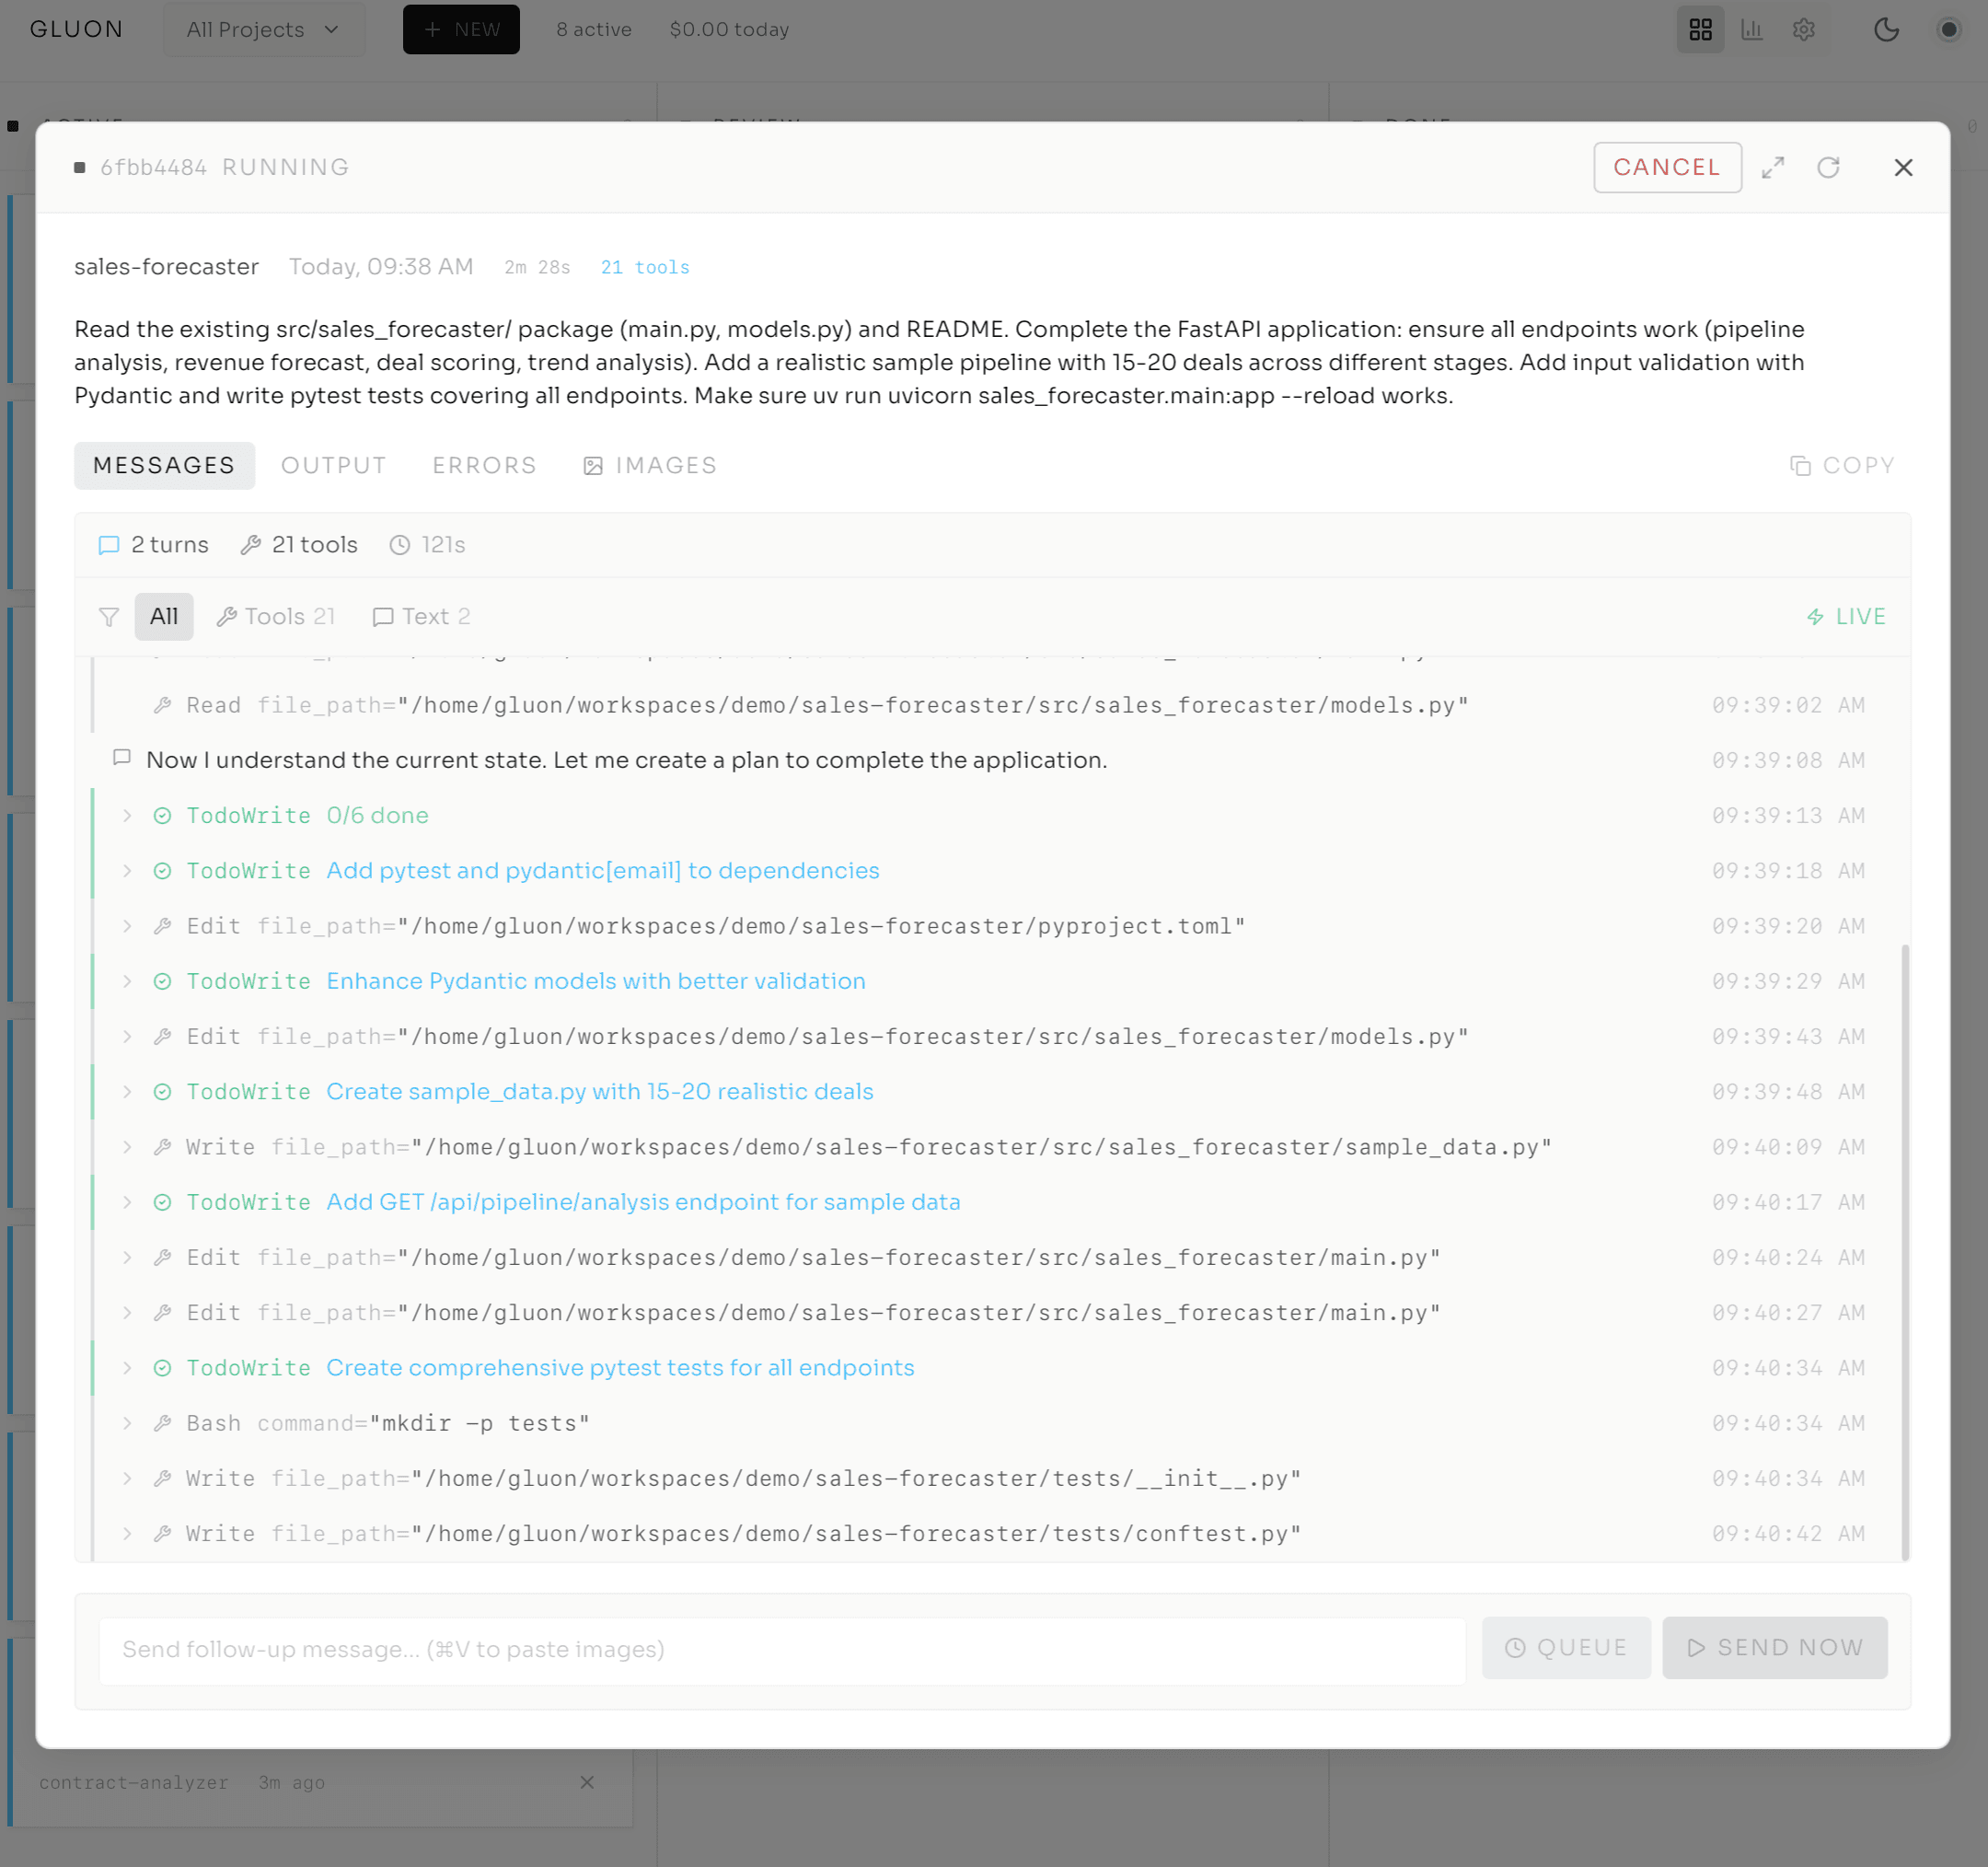
A cost counter ticks in the corner while it works — $0.02, $0.04, $0.07 — so there's no surprise on the invoice. I can filter by tool type, pause auto-scroll to read carefully, and expand tool calls to see inputs and outputs. If the agent needs guidance, an "Input Required" badge appears and I jump in via the resume flow. Other systems submit a job and leave you in the dark; here you're witnessing the work, not waiting for it.
The Architecture That Protects Everything
Here's the decision that makes all of this safe enough to trust.
Rendering diagram...
Each task runs in /tmp/gluon-worktrees/wt-{run_id}/ — a temporary git worktree, a lightweight isolated clone of your repository. The agent makes changes, commits, and pushes, but it's working on branch gluon-task/{run_id}, unique to that task. Main stays clean.
If the agent makes a terrible decision, the damage is confined to its own branch. Delete the worktree, move on. Compare this to agents with no isolation: the Replit AI agent deleted an entire production database. With Gluon, worst case is you lose the worktree.
Before each task starts, Gluon syncs — fetch from remote, fast-forward if behind, auto-commit any uncommitted changes in main. After the task completes, it stages, commits, and pushes; rebase conflicts get handled automatically. And the isolation extends to parallel work: Agent One works on auth in wt-abc123, Agent Two on the API in wt-def456, completely invisible to each other. That's how you scale from one agent to many — by making collision impossible, not by hoping it doesn't happen.
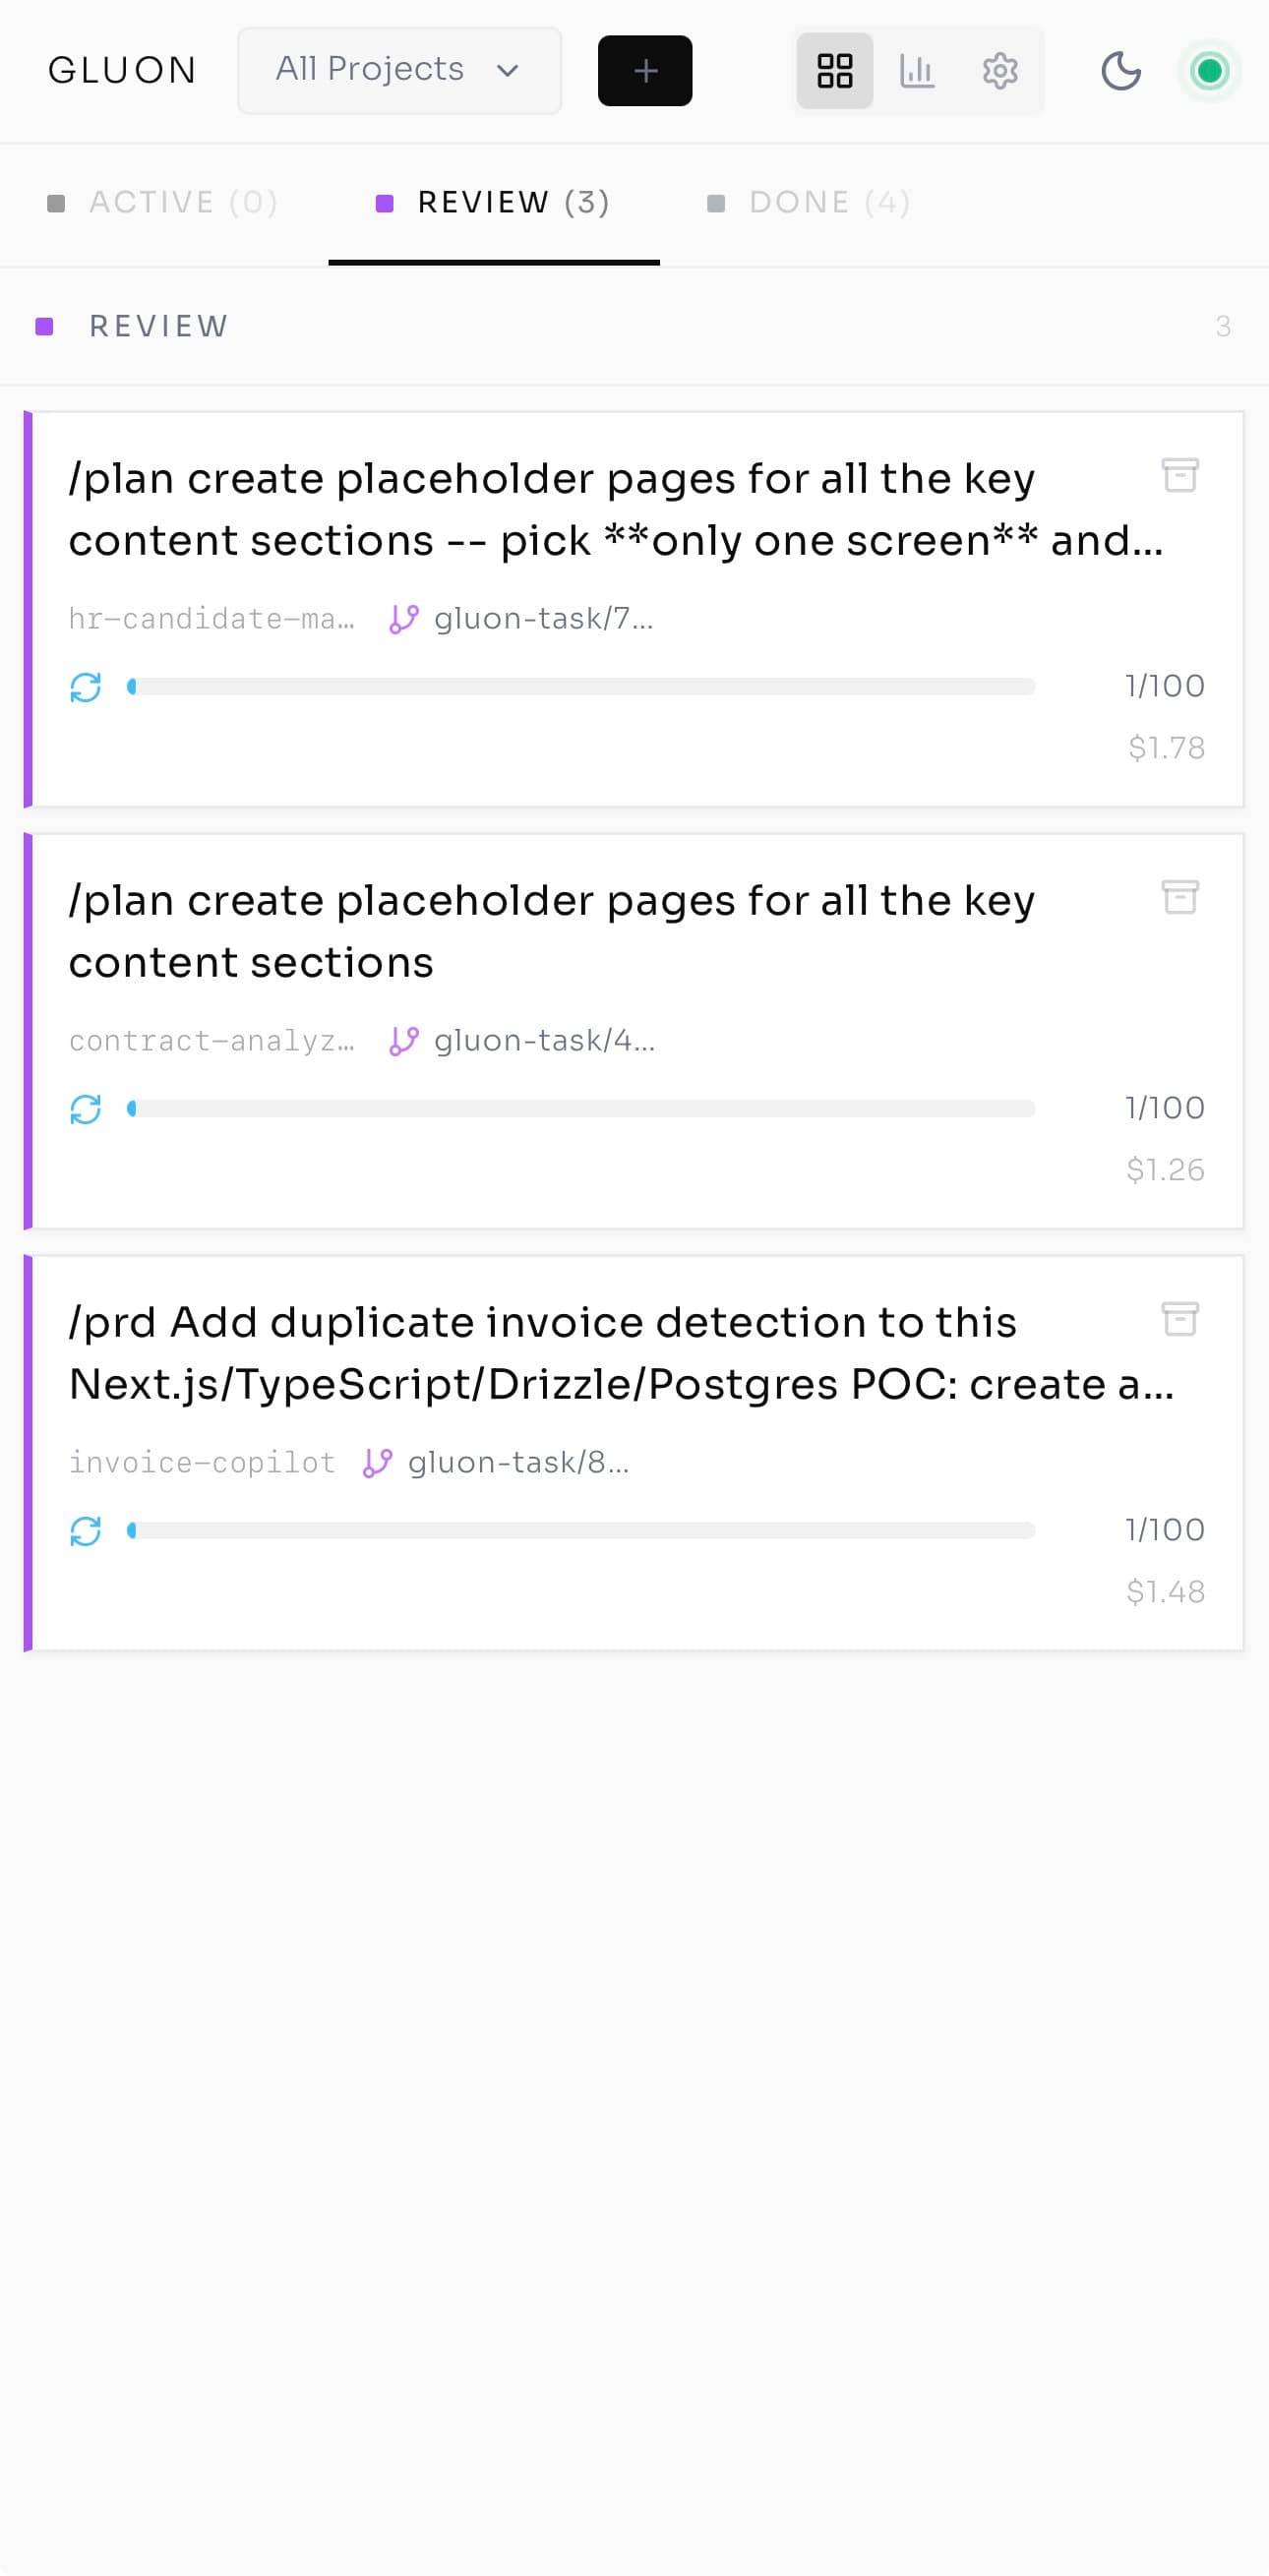
The Kanban Board — One Screen, Many Pilots
Four columns: Queue (waiting), Running (executing), Review (waiting for human decision), Done (complete). Each task is a card carrying its title and project, a profile icon for the model, a progress bar for multi-step formulas ("Step 2/4 Implement"), a health dot — green (healthy), yellow (slow), red (stuck or looping) — and an Input Required badge when the agent is waiting for approval.
My board right now: one task in Queue (a feature request), two Running — the auth bug (green) and an API refactor (yellow, slower than expected but progressing) — one in Review (yesterday's test-writing task), one Done and ready for PR. Drag tasks between columns to pause or promote; click any card for full Run Details. That's the shift from chasing work across terminals to making decisions from a single screen.
Deep Diagnostics — Everything About a Task
The same tabs go deep. Messages holds the full conversation with expandable tool calls and inline screenshots. Commits lists every commit during the run — author, timestamp, message, files changed, click for full diff. Files shows all changes with line counts and an inline diff viewer. Loop tracks Ralph iteration progress and circuit breaker state.
I click Commits for the auth bug. Three commits:
- "Add test case for email validation with new TLDs"
- "Fix regex pattern to support .cloud, .app, .dev"
- "Add test for edge case: nested subdomains"
The first adds failing tests; the second changes the regex — old pattern handled only standard TLDs, new one handles arbitrary extensions — and tests pass.
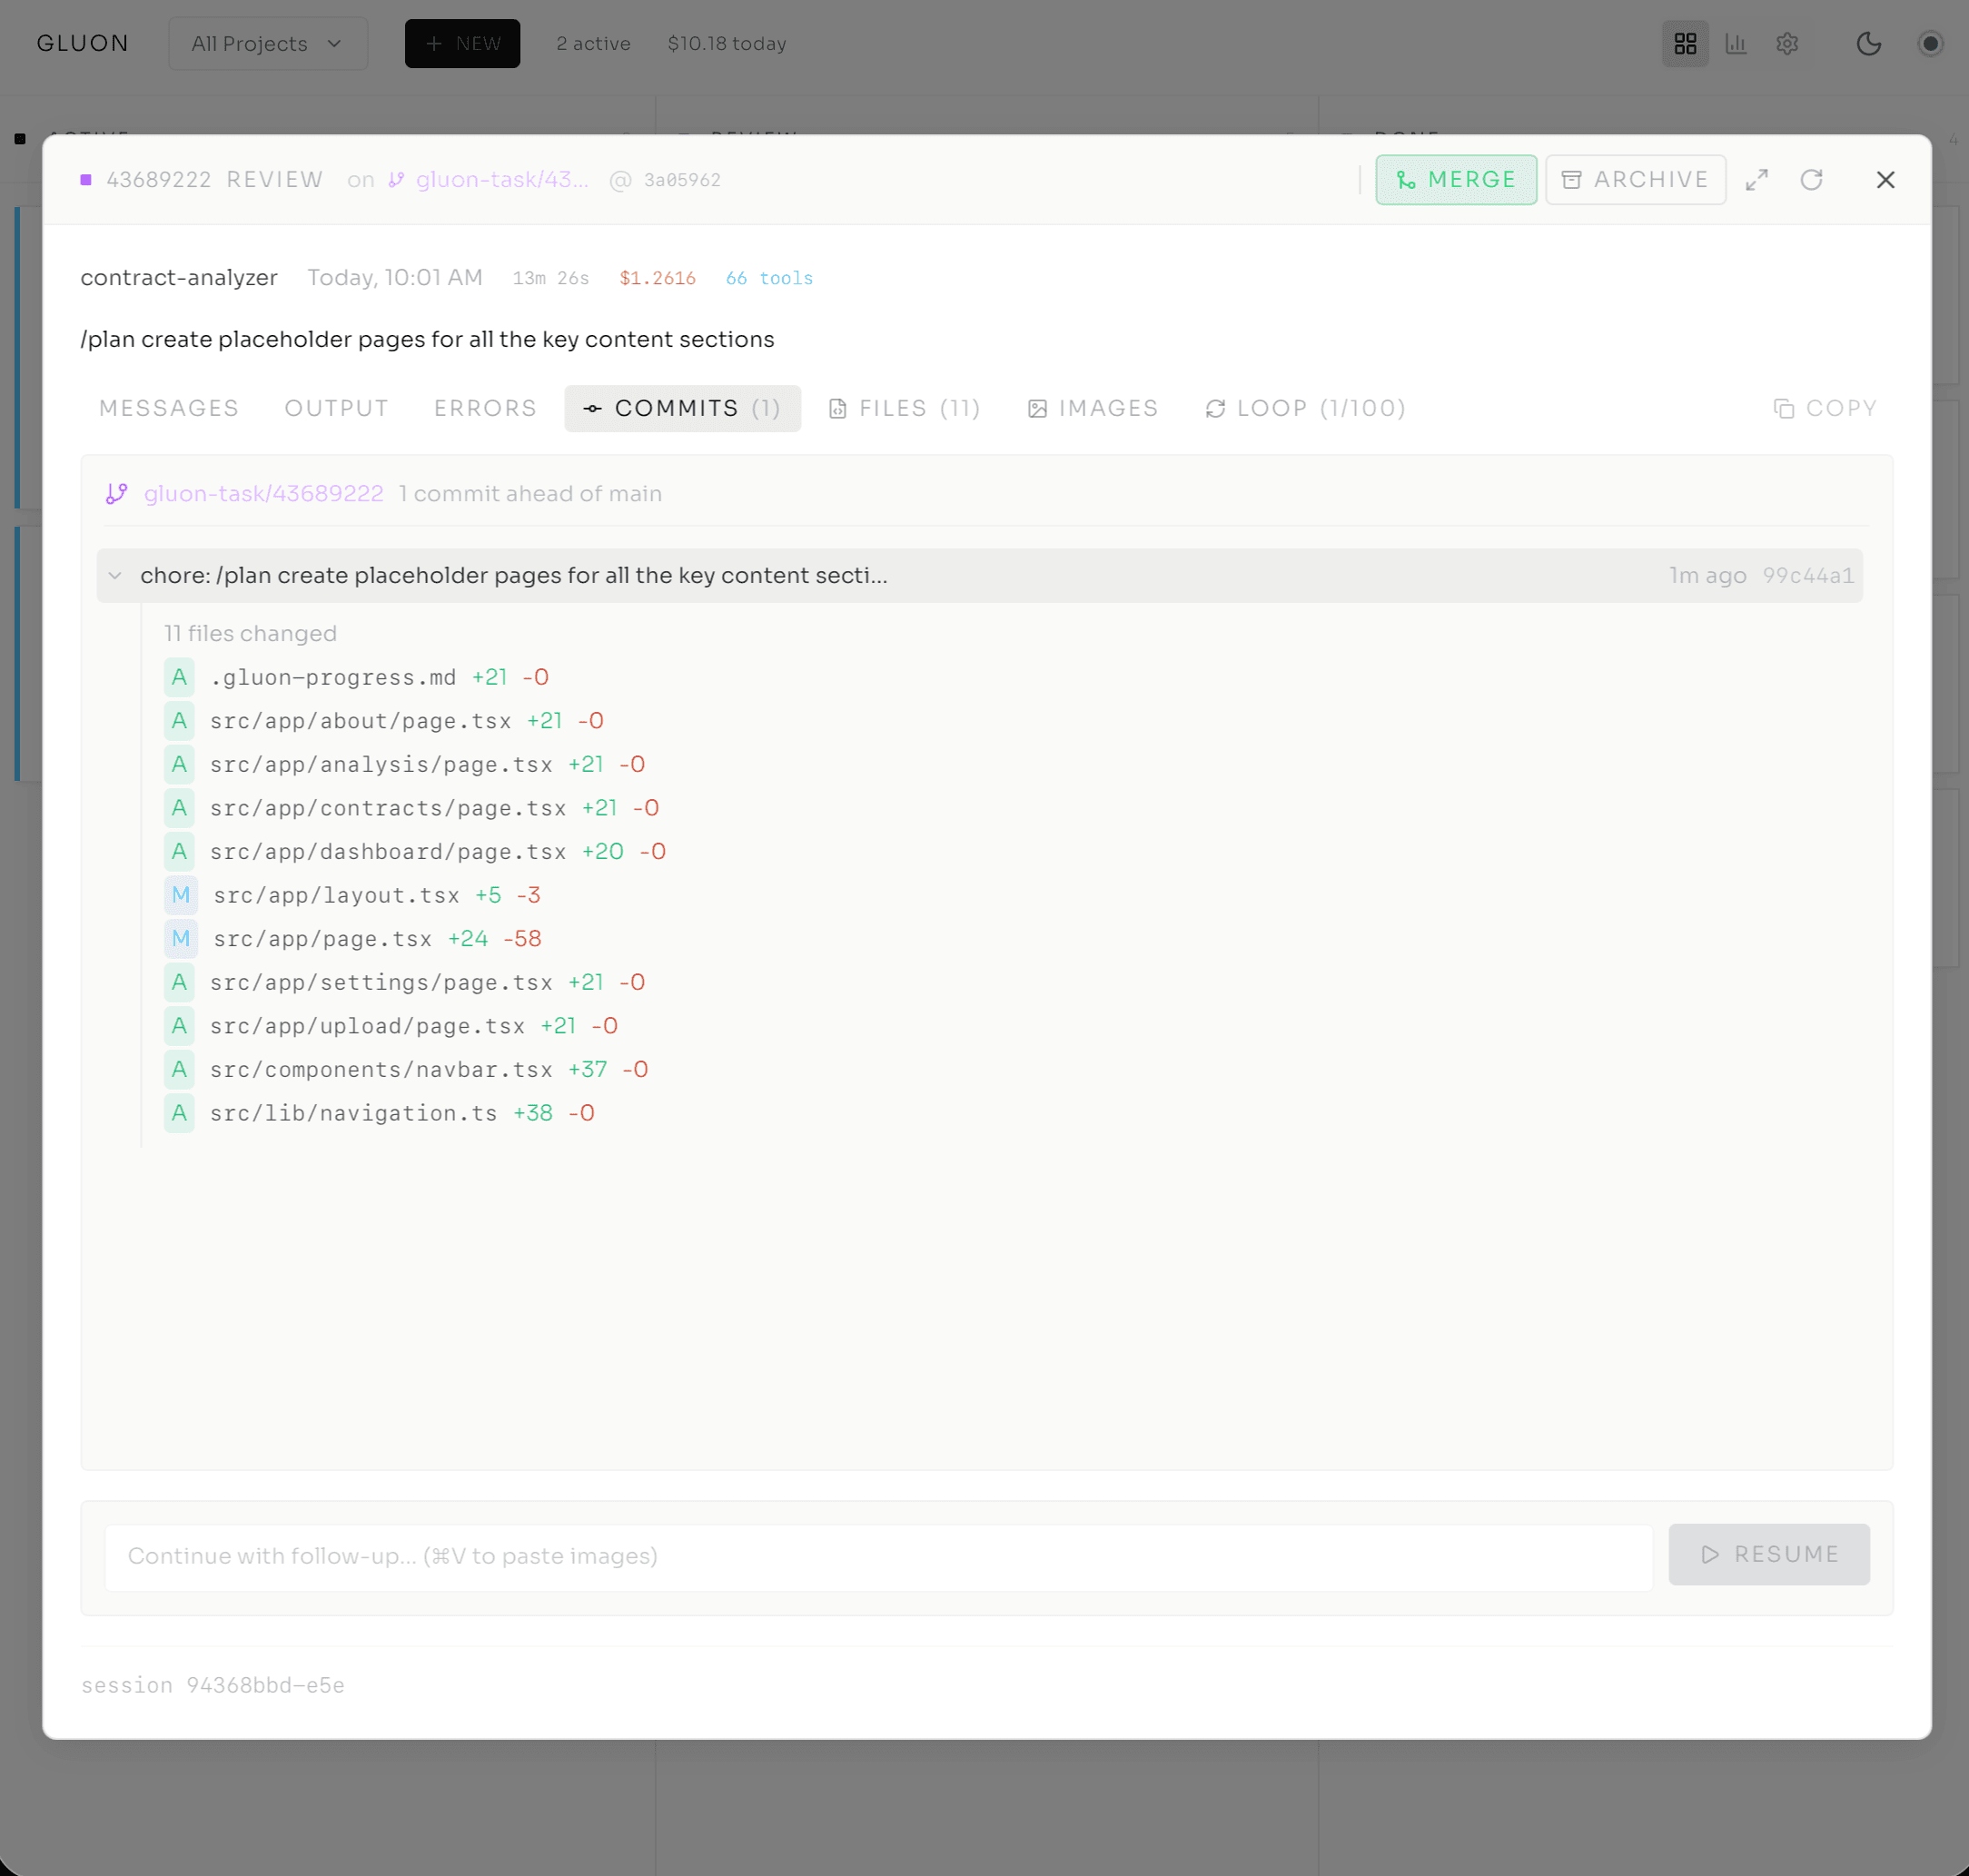
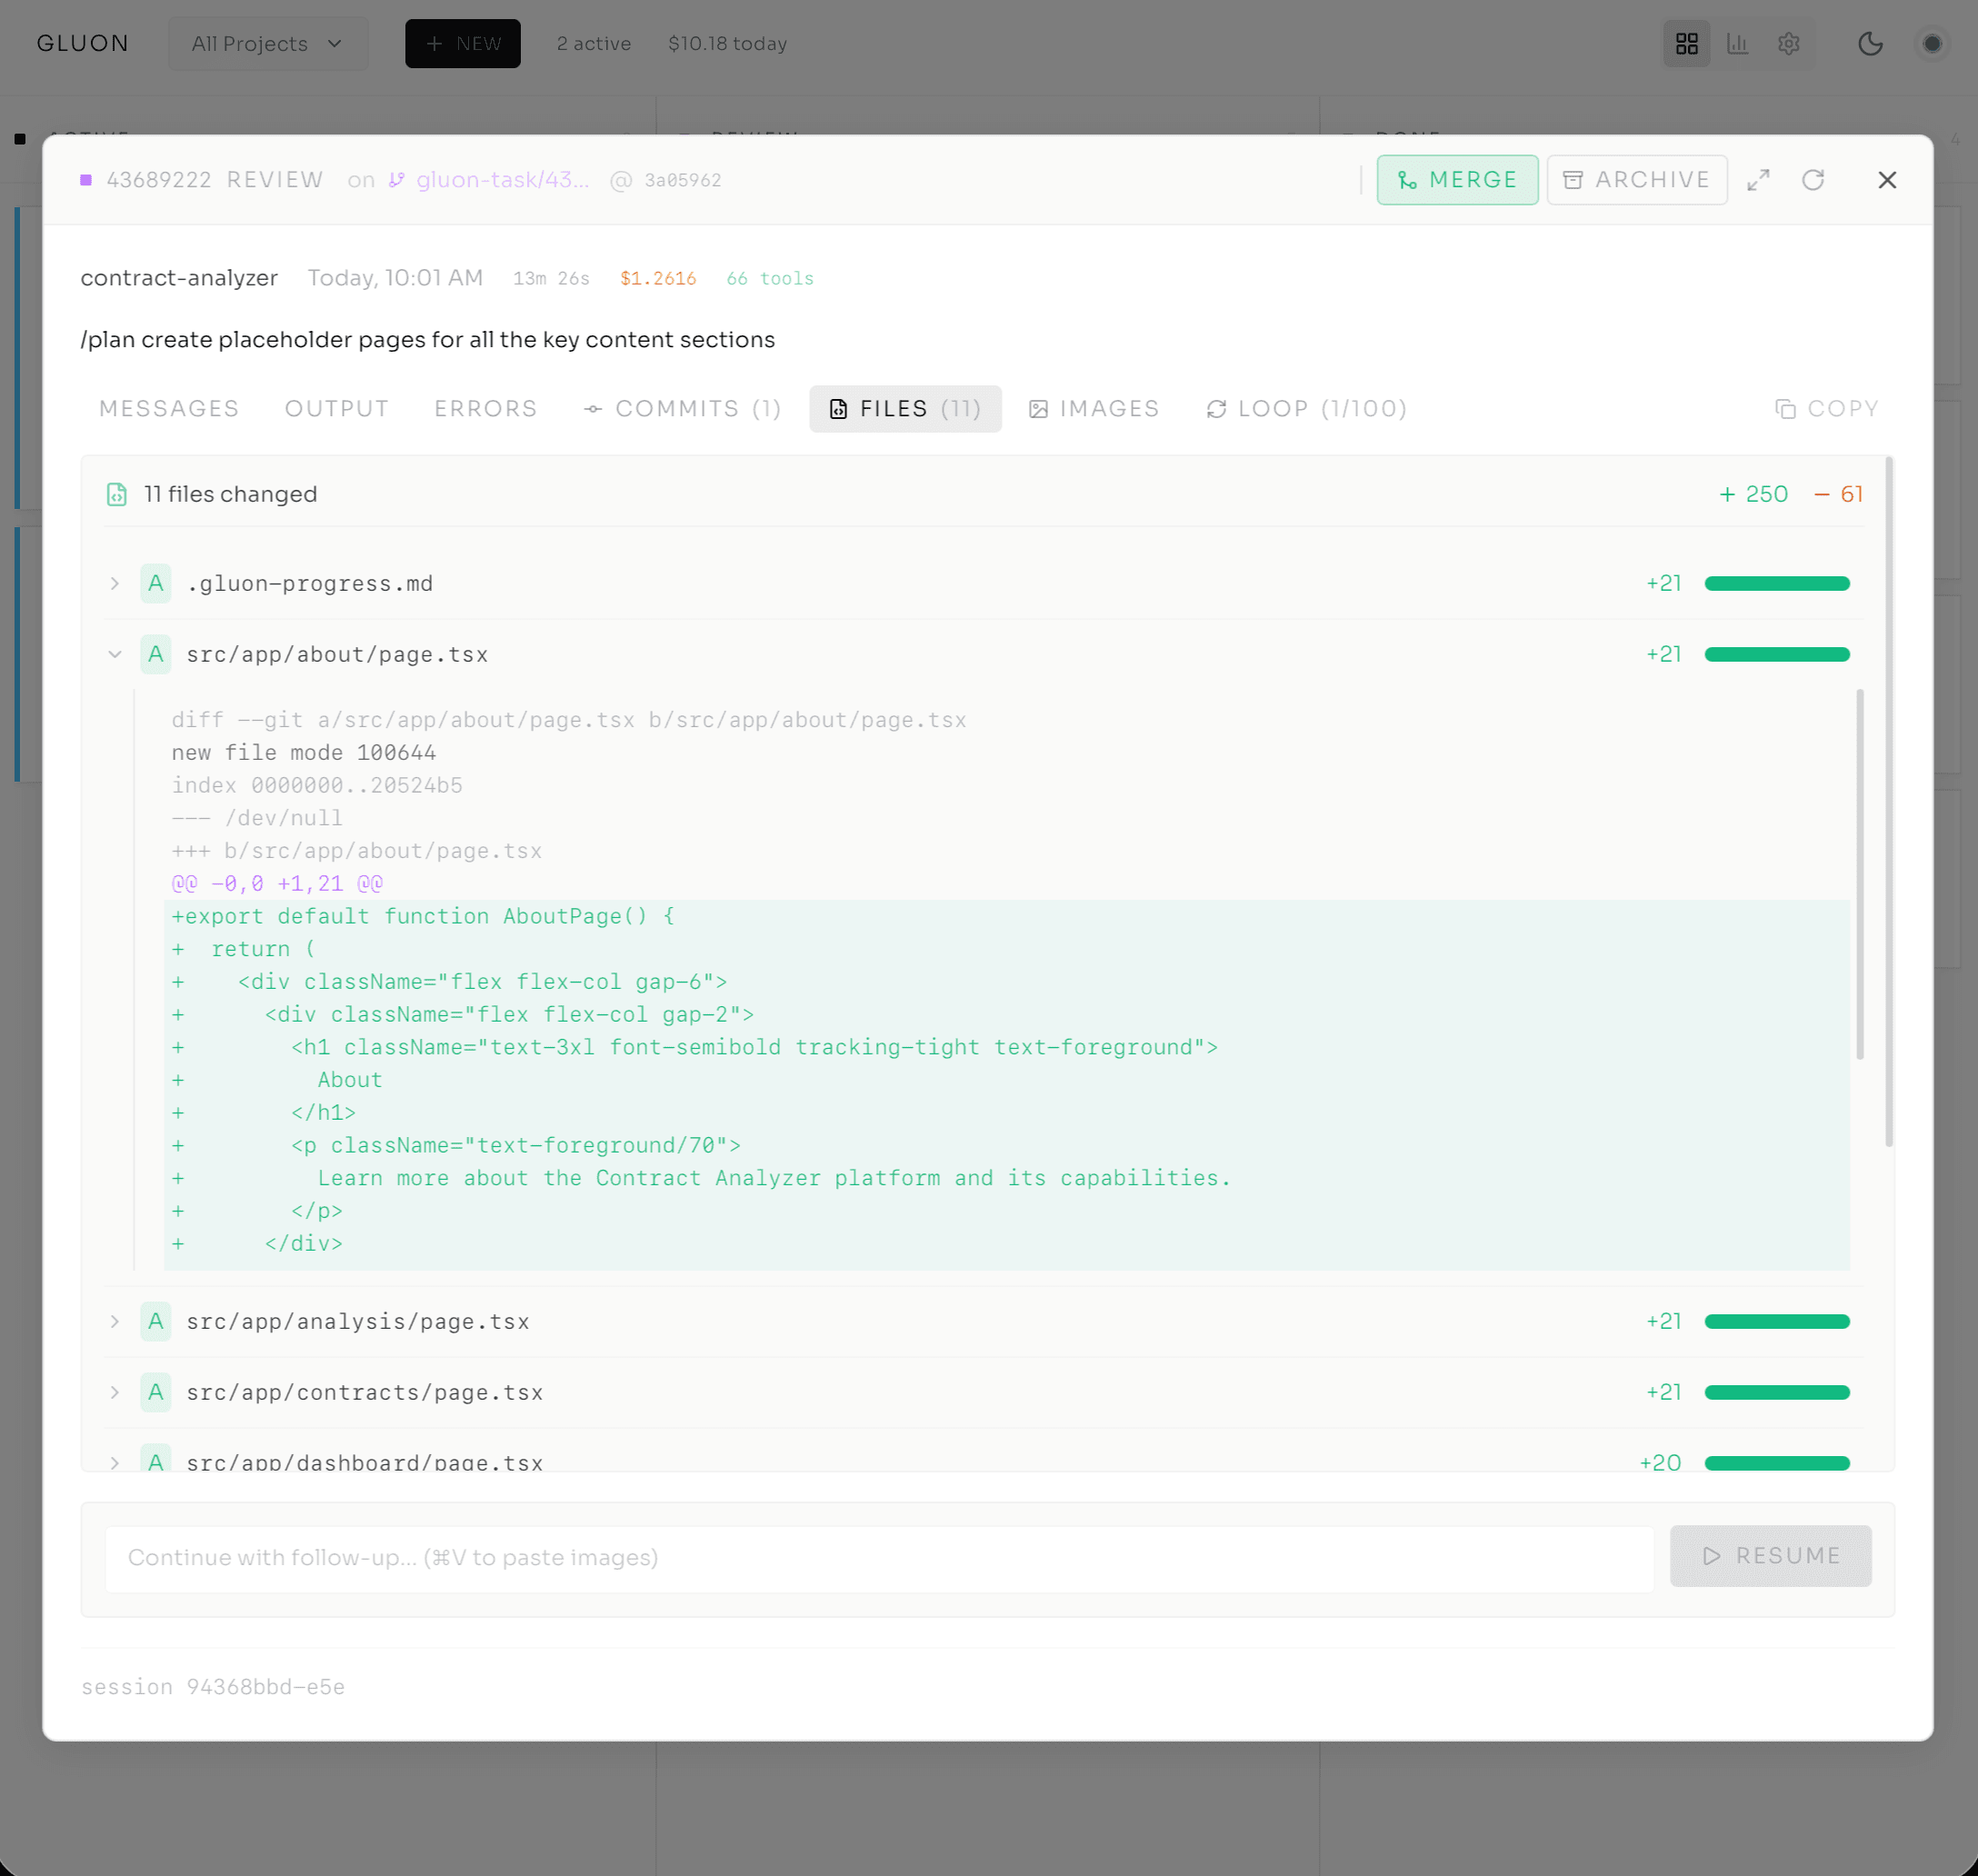
Everything I need to decide — merge or refine — is right there. No switching to a terminal, no cloning branches to inspect locally.
The Numbers You Actually Need
Cost tracking sounds mundane until you realize the difference between model tiers is 25x:
- Haiku: ~$36K/year running continuously
- Sonnet: ~$180K/year
- Opus: ~$900K/year
That's the difference between a viable workflow and an unsustainable one — so you need to know, per task and per project, what you're spending. The Costs dashboard shows real-time spend: today $4.32 (five tasks), this week $14.78, this month $32.11. Click into a project:
auth-service: $8.94
- Task 1 (Standard, Sonnet): $0.47
- Task 2 (Deep, Opus): $1.23
- Task 3 (Quick, Haiku): $0.03
Each task shows the model and exact cost, and I can set a cost cap on any task with --max-cost. Set it to $5, the agent stops at $5. Run agents without cost visibility and you're flying without a fuel gauge — you find out you're empty when you crash.
Same Orchestrator, Every Surface
I submit a task from the web dashboard. Thirty seconds later a coworker checks status via Telegram — same task, different interface — types /logs and sees the real-time stream inline.
That night on the couch I pull up Gluon on my phone. It's a PWA, installable like a native app: pull to refresh, same Kanban board, responsive. The task from this morning shows green.
Back at my desk, gluon logs {run-id} -f streams the same logs to my terminal. One SQLite database, one FastAPI backend, one WebSocket layer — CLI, web, Telegram, Discord, PWA all the same system. Because the interface layer is decoupled, adding a surface doesn't touch the core: a Slack bot, email, or custom webhook all route through the same orchestrator. Wherever I am — desk, couch, coffee queue — the board is one tap away.
The Question, Answered
After enough real work had run through the board, I noticed I'd stopped asking the question I opened with — is it still running? Not because it stopped mattering, but because the answer was always one glance away. Green dot, yellow dot, red dot. The cockpit answers before you ask.
That foundation is what makes Part 3 possible: the Ralph Loop, where you stop monitoring each step and let the agent decide for itself, bounded by a cost cap and an iteration limit, running until the work is done. But autonomy only works once you trust the cockpit first.
Series Navigation
- Post 1: From tmux Chaos to AI Agent Orchestration
- Post 2: Inside the Cockpit (you are here)
- Post 3: Ralph Loop — Autonomous Execution
- Post 4: From Solo Tool to Team Infrastructure
$ subscribe --newsletter
Practical AI engineering, in your inbox
Field notes for technical leaders building agents, evaluation systems, governance, and production infrastructure.
Related
From Solo Tool to Team Infrastructure: Scaling Gluon for Production
When I first built Gluon on my Mac mini, I was solving a personal problem: monitoring Claude agents without losing my mind to tmux logs. But when teams join the picture, everything changes — security, governance, observability, and the fundamental role of the developer. Here's what production infrastructure for autonomous agents looks like.
The 30 Principles for Agentic Engineering — Part 3: The Harness
Principles 15–20. The harness configuration that keeps the kernel and lifecycle cheap: CLAUDE.md under 200 lines, hooks for real incidents, skills that auto-invoke, subagent isolation, pinning, and Stage 5 distribution.
The 15-Tool-Call Rule: Where Agent Quality Falls Off a Cliff
Practitioner consensus puts the cliff around fifteen tool calls per prompt. Here's why agents degrade past that, and the three operational rules that keep them on the safe side.