
Social Picture Sharing: Instagram nears 60% market share
$ grep -n "^##" 2012-08-social-picture-sharing-instagram-nears-60-market-share.md
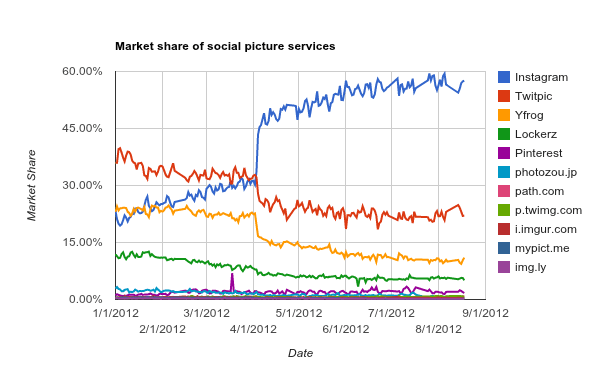
Highlights
- Instagram's massive surge in April is likely due to:
- release of their Android app
- publicity around the Facebook acquisition
- Twitpic, Yfrog, Lockerz were already in decline before Instagram's surge and are flattening out
- Pinterest (very slowly) increased its share from 1% to 2% for the year to date
Background
The Twitter "spritzer" stream — a random sample approximately 1% of the full firehose — is freely available and I have been collecting it since the new year. Uncertain as to what I wanted to do with the data I simply wrote the raw JSON stream into ~1GB files, compressed them and stored them in Amazon S3.
The Dataset
As of this morning I have 715 million tweets weighing in around 1.6TB of uncompressed JSON data (270GB compressed). I finally came up with something I wanted from the data, I was interested in extracting links from tweets for a little side-project.
A side-effect of that is the market-share of social picture sharing services looked really interesting so I wanted to share!
Analysis Methodology
To extract the data I wrote a simple Elastic Map/Reduce (EMR) job to churn through the compressed JSON archives. Any tweet that featured a link would be parsed for the host-name and counted in date buckets.
Lastly I filtered the list for domains I knew to be social picture sharing services — if I have missed any please shout about it in the comments below. In the case of Yfrog both counts from yfrog.com and yfrog.us were aggregated.
Important Notes
Facebook was left out because it was non-trivial to disambiguate what was being linked to (status, pics, videos, apps etc.)
If you are interested in any further information that I can glean from this data, please let me know. I already have a bunch more charts from this dataset I'll post about later this week.
$ subscribe --newsletter
Practical AI engineering, in your inbox
Field notes for technical leaders building agents, evaluation systems, governance, and production infrastructure.
Related
Social TV is Dead?
Despite claims that Social TV is dead, data from 486,659 Zeebox tweets and 4.3M Miso tweets reveals a more complex reality in the second-screen battle.
26 Minutes vs 33 Seconds: What Production Data Tells Us About Agentic AI
Perplexity's own data shows its agent does 48× more machine work per session than its search product — but the 87% time saving rests on ten assumed minutes of human oversight, and that is the number a buyer needs.
Before Buying More AI Seats, Fix One Handoff
A CI alert becomes useful work when its revision, evidence and next owner survive the handoff; another prompt template does not supply them.